Examples
This chapter is a modular tutorial built around various examples illustrating the use of the pypsucurvetrace tools. It is assumed that you have the pypsucurvetrace software installed on your computer (see Installation for details).
Working with the curvetrace program
Configure the PSUs
To use the curvetrace program, you need to setup the PSU configuration file (see Power supply configuration). It is assumed that PSU1 unit is a Riden 6012P operating in it’s 6 A / high-resolution mode, while PSU2 is a Riden 6006P (see Supported power supplies). These PSUs will be useful for testing a wide range of differen DUT types.
The simplest method to determine the COMPORT for PSU1 on Linux is to disconnect all serial interfaces except PSU1, and then list the virtual file representing the PSU1 serial port in the /dev/serial/by-path/ directory. Repeat for PSU2.
To set up a minimal PSU configuration file that contains all information for the curvetrace program to establish the communication with PSU1 and PSU2, create a curvetrace_config.txt file in your home directory and enter the following parameters (your COMPORT settings will be different)::
[PSU1]
TYPE    = RIDEN_6A
COMPORT = /dev/serial/by-path/pci-0000:00:14.0-usb-0:2.4.3:1.0-port0

[PSU2]
TYPE    = RIDEN
COMPORT = /dev/serial/by-path/pci-0000:00:14.0-usb-0:2.4.2:1.0-port0
If you have different PSUs for different curve-tracing needs, it may be convenient to keep the configurations of all PSU devices in the curvetrace_config.txt file. Just make sure the active PSU1 and PSU2 devices are labelled [PSU1] and [PSU2], while the unused PSUs are labelled differently so they will be ignored by the curvetrace program. For example, if you would like to keep around the configurations for the Riden 6012P at 12 A / low-resolution mode and a BK Precision PSU, you could add them as disabled PSU1 to the curvetrace_config.txt file:
[disabled PSU1]
# Riden 6012P at 12A/high-res mode
TYPE    = RIDEN_6A
COMPORT = /dev/serial/by-path/pci-0000:00:14.0-usb-0:2.4.3:1.0-port0

[disabled PSU1]
# BK Precision
TYPE    = BK
COMPORT = /dev/serial/by-id/usb-Silicon_Labs_CP2102_USB_to_UART_Bridge_Controller_508D19126-if00-port0

[PSU1]
# Riden 6012P at 6A/high-res mode
TYPE    = RIDEN_6A
COMPORT = /dev/serial/by-path/pci-0000:00:14.0-usb-0:2.4.3:1.0-port0

[PSU2]
TYPE    = RIDEN
COMPORT = /dev/serial/by-path/pci-0000:00:14.0-usb-0:2.4.2:1.0-port0
Testing a low-power N-channel FET
This first example uses the PSU configuration from above to demonstrate the curve tracing of a J112 N-channel jFET.
The J112 needs a positive Drain-Source voltage (\(U_1\)) and a negative Gate-Source voltage (\(U_2\)). Therefore, connect PSU1 with positive polarity and PSU2 with negative polarity to the J112 pins following the schematic in The curvetrace program:
PSU1-red to the Drain pin
PSU1-black to the Source pin and to PSU2-red
PSU2-red to PSU1-black
PSU2-black to a grid-stopper resistor at the Gate pin (approximately 1 kΩ)
The test parameters for the J112 are defined by creating a J112_config.txt file containing the following parameters (see also DUT test configuration):
[PSU1]
POLARITY = 1
VSTART = 0
VEND   = 15
VSTEP  = 1
IMAX   = 0.05
PMAX   = 0.25
VIDLE  = 7.5
IIDLE  = 0.02

[PSU2]
POLARITY = -1
VSTART = 0.0
VEND   = 3.5
VSTEP  = 0.5
IMAX   = 1
PMAX   = 1
VIDLE     = 5.0
VIDLE_MIN = 0.0
VIDLE_MAX = 5.0
IDLE_GM   = -0.01
IIDLE     = 1

[EXTRA]
IDLESECS    = 0
PREHEATSECS = 20
Execute the following command to start the curve tracing:
curvetrace -config J112_config.txt
The curvetrace program starts communication with the PSUs, configures the test parameters, and asks you for a file name to save the DUT test data. Once everything is ready, the curvetrace program runst the pre-heat process by setting \(U_1\) to the PSU1-VIDLE value (7.5 v) and adjust \(U_2\) until \(I_1\) attains the PSU1-IIDLE value of 0.02 A (20 mA). After 20 seconds the pre-heat is stopped (PREHEATSECS), and the curve tracing starts. \(U_2\) is set to 0.0 V, and \(U_1\) is stepped from 0-15 V in 1 V steps. This sequence is repeated for \(U_2\) = -0.5 V, -1.0 V, … , and -3.5 V. At each step, \(U_1\), \(I_1\), \(U_2\), and \(I_2\) are measured and saved to the data file. The curvetrace program shows a live plot of the curve data during the measurement as shown below.

Testing a low-power NPN BJT
This example demonstrates how to test a bipolar transistor (BJT). In contrast to the previous example with the voltage-controlled FET, the BJT is controlled the base current. Since the base current is typically much smaller than the current measurement resolution of most PSUs, the curvetrace program uses the \(R_2\) resistor to convert the \(U_2\) voltage to the base current value (see ref:curvetrace for details). The conversion relies on the \(R_2\) value, which must be determined considering the max. \(U_2\) output voltage of the PSU2 and the max. \(I_{\rm B}\) current required for the test. The max. output voltage of PSU2 (Riden 6006P) is 60 V, and the targeted base current should range up to about 50 μA. With \(I_{\rm B}\) = (\(U_2\) - \(V_{\rm BE,on}\)) / \(R_2\), a suitable value for the test setup is \(R_2\) = 100 kΩ.
The BC550 needs a positive Collector-Emitter voltage (\(U_1\)) and a positive Base-Emitter voltage (\(U_2\)), so you need to connect the pins as follows:
PSU1-red to the Collector pin
PSU1-black to the Emitter pin and to PSU2-black
PSU2-red to the Base pin via the 100 kΩ \(R_2\) resistor
PSU2-black to PSU2-black
The test parameters for the BC550 are defined in the same way as in the previous example by creating a file BC550_config.txt with the following parameters:
[PSU1]
POLARITY = 1
VSTART = 0
VEND   = 20
VSTEP  = 1
IMAX   = 0.1
PMAX   = 0.5
VIDLE  = 5
IIDLE  = 0.02

[PSU2]
POLARITY = 1
VSTART = 0.65
VEND   = 6.65
VSTEP  = 0.5
IMAX   = 0.1
PMAX   = 1
VIDLE     = 0.8
VIDLE_MIN = 0.0
VIDLE_MAX = 20
IDLE_GM   = 0.01
IIDLE     = 1

[EXTRA]
R2CONTROL = 100000
IDLESECS    = 2
PREHEATSECS = 60
Run curvetrace:
curvetrace -config BC550_config.txt
- The curve tracing works in the same way as in the previous example, with two notable differences:
The \(U_2\) steps start at 0.65 V, which is the (assumed) \(V_{\rm BE,on}\) value of the BC550. The conversion from \(U_2\) to the base-current will done later during curve plotting and data processing (see also Working with the curveplot program, Working with the curveprocess program and Working with the curvematch program).
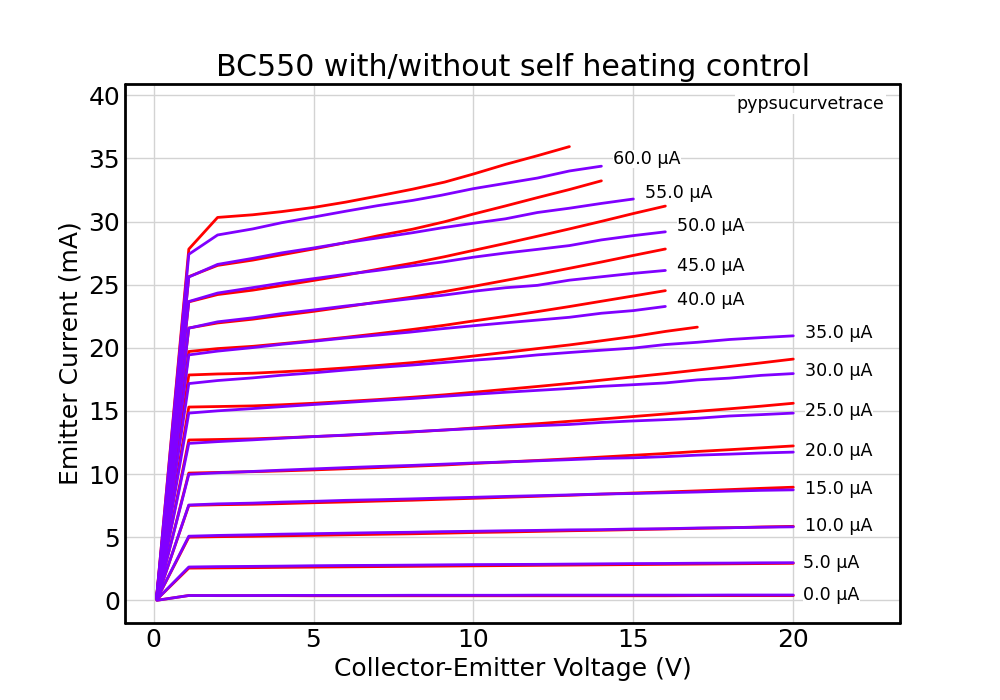
There is a 2 second idle time between each reading for thermal re-equilibration of the BC550 before each reading. This reduces the thermal runaway at higher power levels due to self-heating of the transistor. The following plot compares the BC550 curves measured with and without the idle time between readings:
Using a heater block to test a power transistor at controlled temperature
Power transistors can produce a lot more heat than the low-power components considered in the previous examples. To avoid thermal runaway and distortion of the curves at high power levels, the DUT temperature must remain stable during curve tracing. In principle, this could be achieved in the same way as in the BC550 example, where the DUT was operated at a fixed power level to attain thermal equilibrium during idle periods before each measurement. However, at higher power levels, the required idle periods can become excessively long, and self-heating during a single measurement may become significant. The «idle period» method therefore does not work well for testing transistors at high power levels.
A more efficient method to control the DUT temperature is to clamp it to a large block of metal with a regulated heater element. The thermal inertia of the metal block greatly reduces short-term fluctuations of the DUT temperature. The heater allows controlling the temperature of the metal block and the DUT to a predefined value. See Heater Block and Construction of a heater block for DUT temperature control for more details.
To use the temperature control of the heater block, add the following parameters to the [EXTRA] section of your DUT test config file:
[EXTRA]
...
T_TARGET = 50
T_TOL    = 0.5
The below figure shows the curves from an IRFP150 power FET, which was clamped on a heater block. The curves were measured at 30°C, 50°C and 70°C. The curves do not show any thermal runaway, because the temperature was always stable to within 0.5°C of the nominal value.

Testing a vacuum tube
Analysing a vacuum tube works in the same way as with semiconductors. The obvious differences are (i) that vacuum tubes require an additional power supply with a fixed output for the heater filament(s) and (ii) that tubes tend to work at higher voltages.
This example assumes a 807 beam power tube configured for triode operation. Connect the filament pins to a 6.3 V / 0.9 A power supply, and Grid-2 to the Anode via a grid stopper resistor (for triode operation).
The anode voltage is controlled by a BK Precision 8158B as PSU1, while the Grid-1 voltage is controlled by the same Riden 6006P as in the previous examples (see Configure the PSUs for a convenient method to switch between PSU units for different applications).
The tube needs a positive Anode-Cathode voltage (\(U_1\)) and a negative Grid-Cathde voltage (\(U_2\)), so you need to connect the pins as follows:
PSU1-red to the Anode pin
PSU1-black to the Cathode pin and to PSU2-red
PSU2-red to PSU2-black
PSU2-black to the Grid-1 pin (via a grid stopper resistor)
The test parameters for the 807 tube are defined in a 807_triode_config.txt file, which might look like this:
[PSU1]
POLARITY = 1
VSTART = 0
VEND   = 400
VSTEP  = 5
IMAX   = 0.125
PMAX   = 50
VIDLE  = 300
IIDLE  = 0.075

[PSU2]
POLARITY = -1
VSTART = 0.0
VEND   = 60
VSTEP  = 5
IMAX   = 1
PMAX   = 5
VIDLE     = 25.0
VIDLE_MIN = 0.0
VIDLE_MAX = 60.0
IDLE_GM   = -0.007
IIDLE     = 1

[EXTRA]
IDLESECS    = 0
PREHEATSECS = 300
Note the somewhat long pre-heat time (PREHEATSECS=300), which makes sure the tube has warmed up and stabilized before the curve tracing starts. Also, make sure to not skip the grid stopper resistors at Grid-1 and Grid-2 to prevent oscillation. With this test setup, the curves recorded with the curvetrace program will look like in the figure below.

Batch mode
When testing multiple DUTs of the same type, it may be useful to use the --batch mode of the curvetrace program. In this mode, the curvetrace program will automatically enumerate the file names and sample labels. Also, if a heater block is used, it will keept the temperature control active between test runs to avoid the down time related to temperature stabilization. To run a batch of 2SK82 VFETs, you would run curvetrace with the --batch flag as follows:
curvetrace --config 2SK82_config.txt --batch
The curvetrace program will ask for the base name to use for the file names and sample labels before running the test procedures for each DUT. Once it’s done with testing the first DUT, it will tell you to install the second DUT before it continues with the testing.
Construction of a heater block for DUT temperature control
This example illustrates the design and construction of a heater block for temperature control of the DUT during curve tracing (see also Heater Block).
Here’s a photo of the heater block:
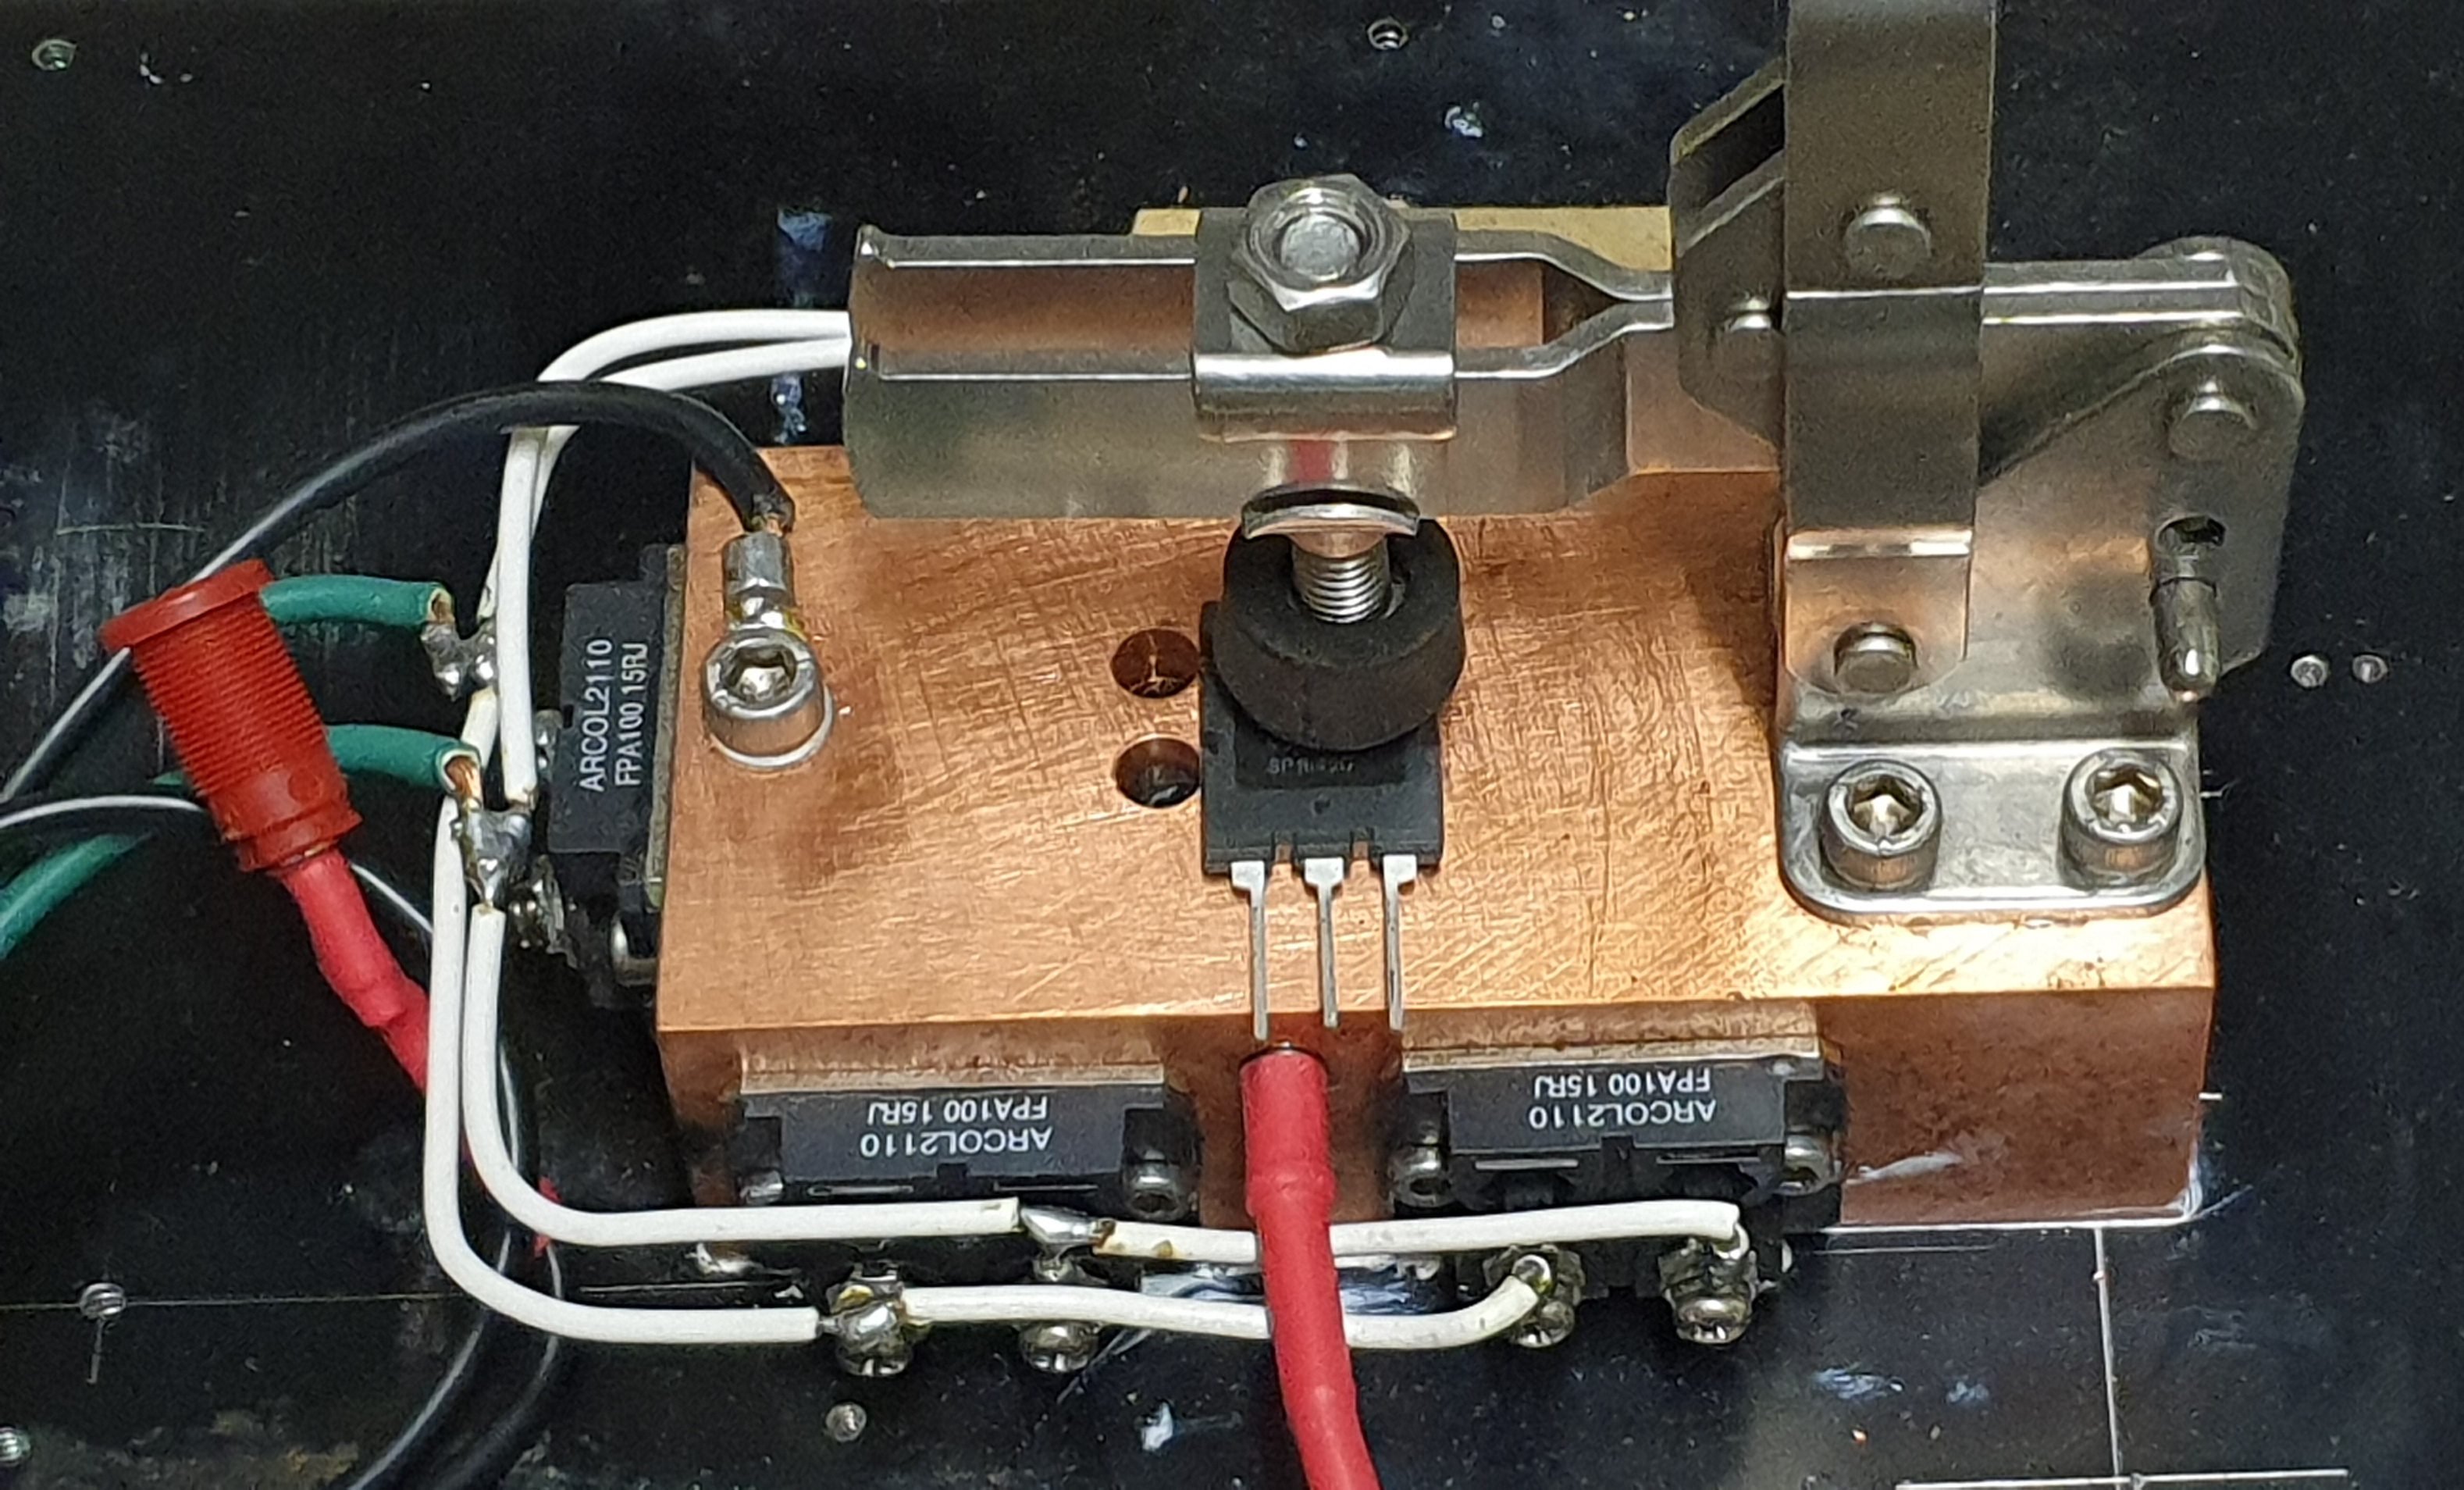
The heater block in this example is powered by a Voltcraft PPS-16005 PSU (36 V / 12 A max. output).
- The following parts were used to build the heater block:
A copper block with a weight of approximately 2.8 kg (13 cm × 6 cm × 4 cm). Copper has a specific heat of 0.385 kJ/kg/K, so the heat capacity of the copper block is approximately H = 1 kJ/K.
Five 100 W power resistors (Arcol FPA100). The resistors were bolted to the sides of the copper block. To fully exploit the power provided by the PSU (up to 36 V / 12 A / 430 W), the resistance of the resistor array should be 36 V / 12 A = 3 Ω. With the resistors connected in parallel, the resistance of the single resistors is 5 × 3 Ω = 15 Ω.
A DS18B20 temperature sensor with a metal sleeve housing was inserted and glued into a bore to measure the temperature of the copper block just underneath the DUT. An FTDI TTL-232R-RPI cable was used to interface the 1-Wire bus of the DS18B20 sensor chip to the USB port of the computer (COM port =
/dev/serial/by-id/usb-FTDI_TTL232R-3V3_FTBZLSUL-if00-port0).An adjustable toggle lever clamp was mounted on the top of the copper block to allow easy clamping of the DUT to the copper block.
The copper block was bolted to a large heatsink to allow efficient dissipation of any excess heat. The heatsink improves the cooling the heater block and therefore helps with the regulation of the heater block temperature.
The time required to heat the copper block to a predefined temperature depends on the heating power P (430 W), the heat capacity H of the copper block (1 kJ/K), and the temperature change ΔT. For example, heating the block from 20°C to 50°C (ΔT = 30 K) will take at least H×ΔT/P = 70 seconds. In practice the heating time will be longer, because the PID controller needs to reduce the power before reaching the target temperature to avoid overshoot of the temperature. The coefficients of the PID controller were estimated as described here by repeated trial-and-error runs of the curvetrace program with different PID coefficient values in the curvetrace_config.txt file.
The [HEATERBLOCK] section in the curvetrace_config.txt file looks like this:
[HEATERBLOCK]

PSU_COMPORT       = /dev/serial/by-id/usb-Silicon_Labs_CP2102_USB_to_UART_Bridge_Controller_0010-if00-port0
PSU_TYPE          = VOLTCRAFT
TEMPSENS_COMPORT  = /dev/serial/by-id/usb-FTDI_TTL232R-3V3_FTBZLSUL-if00-port0
TEMPSENS_TYPE     = DS1820
TBUFFER_NUM       = 5
TBUFFER_INTERVAL  = 1
HEATER_RESISTANCE = 3
MAX_POWER         = 430
KP                = 100
KI                = 1.3
KD                = 100
Working with the curveplot program
The first example uses the curves measured in the above curvetrace example for the 807 tube. The curveplot program produces a simple plot of the 807 curves from the data file with the name 807curves.dat:
curveplot 807curves.dat
This will plot the curves on the screen as shown in the above figure, except that the title and axis labels may benefit from some tweaking. For example:
curveplot 807curves.dat --title "807 Tube (triode connected)" --xlabel "Anode-Cathod Voltage" --ylabel "Anode Current"
Note how the units on the axes are automatically determined and added by the curveplot program.
To save the figure to a PDF file:
curveplot 807curves.dat --title "807 Tube (triode connected)" --xlabel "Anode-Cathod Voltage" --ylabel "Anode Current" --savepdf
The curveplot program produces a simple plot of the 807 curves from the data file with the name 807curves.dat:
The second example uses the curves measured in the above curvetrace example for the BC550 BJT. The BJT data file (BC550.dat) contains the value of the \(R_2\) resistor used to control the \(I_{\rm B}\) values. If the \(V_{\rm BE,on}\) value is specified to the curveplot program, it will automatically convert the \(U_2\) data to the \(I_{\rm B}\) values applied to the BJT base and use these values as labels for the BJT curves as shown in the above BJT example
curveplot BC550.dat --bjtvbe 0.65
Working with the curveprocess program
To determine the characteristic parameters of a 300B tube at \(U_1\) = 300 V and \(I_1\) = 60 mA:
curveprocess --U1I1 [300,0.06] 300B_1.dat
To process a batch of data files from multiple 300B tubes, and saving the result in a data file:
curveprocess --nohello --U1I1 [300,0.06] 300B_*.dat > 300B_parameters.csv
The program will output the results in comma-separated tabular form:
Filename, Sample, U1 (V), I1 (A), Ug (V), gm (A/V), go (A/V), μ (V/V), T (°C)
300B_1, 300B_TJMesh_1, 300, 0.06, -60.85, 0.004226, 0.000802, 5.269, NA
300B_2, 300B_TJMesh_2, 300, 0.06, -60.15, 0.00418, 0.001451, 2.881, NA
300B_3, 300B_TJMesh_3, 300, 0.06, -58.62, 0.00553, 0.001427, 3.875, NA
300B_4, 300B_TJMesh_4, 300, 0.06, -59.08, 0.005541, 0.001133, 4.889, NA
...
To determine the parameters at several operating points (\(U_1\) = 100, 150,…, 400 V and \(I_1\) = 60 mA):
curveprocess --U1I1 [100:400,0.06:0.06,7] 300B_1.dat
Working with the curvematch program
To determine the «similarity» of all 300B from a batch of data files in the range \(U_1\) = 50…400 V and \(I_1\) = 5…80 mA:
curvematch --U1range [50,400] --I1range [0.005,0.08] --nohello 300B_*.dat
The program will output the results for all DUT pairs in comma-separated tabular form:
Filename-1, Sample-1, Filename-2, Sample-2, U1_range_low (V), U1_range_high (V), I1_range_low (A), I1_range_high (A), delta-Vg (V-RMS), delta-Vg mean subtracted (V-RMS)
300B_1, 300B_TJMesh_1, 300B_2, 300B_TJMesh_2, 50, 400, 0, 0.08, 1.133, 0.8897
300B_1, 300B_TJMesh_1, 300B_3, 300B_TJMesh_3, 50, 400, 0, 0.08, 2.771, 2.332
300B_1, 300B_TJMesh_1, 300B_4, 300B_TJMesh_4, 50, 400, 0, 0.08, 3.991, 3.099
...
Working with the curveconvert program
Convert an Essues eTracer CSV data file ECC81_et.csv to a pypsucurvetrace file (ECC81_pypsu.dat):
curveconvert ECC81_et.csv --etracer > ECC81_pypsu.dat